Debugger
Any program compiled using Lycia can be debugged from within LyciaStudio. The debugger can be invoked by the Debug As... context menu option (in the 4GL Project view) or using the corresponding toolbar button from the Launch command group.
When debugging, the breakpoints can be easily placed within the source code to the lines where they are required.
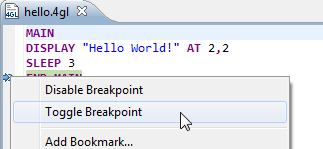
A breakpoint can be placed by a double-click on the vertical ruler in the editor area next to the line at which you want the execution to stop. To remove the breakpoint, double-click it once more or use the context menu of the breakpoint called by right-click:

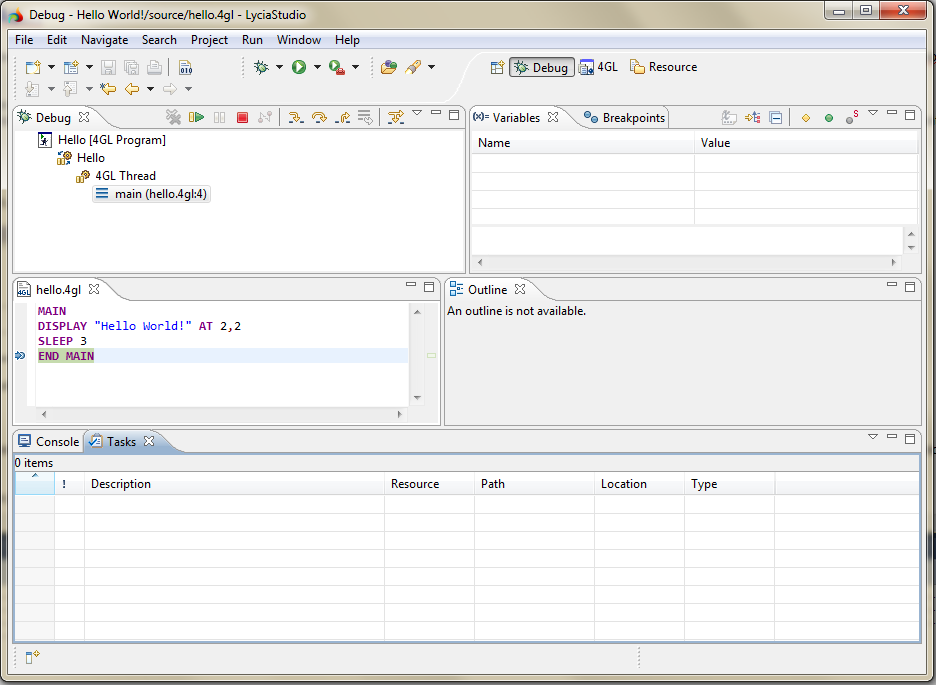
The program is then run in debug mode: the perspective is changed to the debug one:

As it can be viewed from the screenshot above, the debug perspective allows the tracing of the processes running in the selected application. Each time the debugger encounters a breakpoint it terminates an application execution. The developer is allowed to "step through" the program line by line until the problem is detected, or "step over", which executes a command without stepping into it.
The main command within the debugger are listed in the table below.
|
Toolbar Button Icon
|
Toolbar Button Name
|
Hot Keys
|
Description
|
|

|
Resume
|
F8
|
resumes the execution of a suspended program
|
|

|
Suspend
|
|
suspends program execution when not waiting for user input
|
|

|
Terminate
|
Ctrl+F2
|
kills the program being debugged
|
|

|
Step Into
|
F5
|
steps into the function call on the current line – executes every line within a function before moving onto the next line
|
|

|
Step Over
|
F6
|
steps over a function call on the current line – executes the function without stepping into the function
|
|

|
Step Return
|
F7
|
used to return from a function which has been stepped into
|
Watchpoints are similar to breakpoints. A watchpoint is attached to a variable or an expression which is evaluated continually as the program is executed. Program execution is suspended when the value of the evaluated expression changes. To create a watchpoint on a variable, right-click a variable in the 'Variables' view and select 'Create Watchpoint'.
It is also worth noting that when a breakpoint is set on a variable, the value of the variable can be changed, so the developer can simulate certain situations to find out what will happen if a value is ever hit.
Related articles:
Debug perspective
![]()


