Aggregation
With Lycia, you can perform some basic mathematical operations with your data immediately when creating BIRT reports.
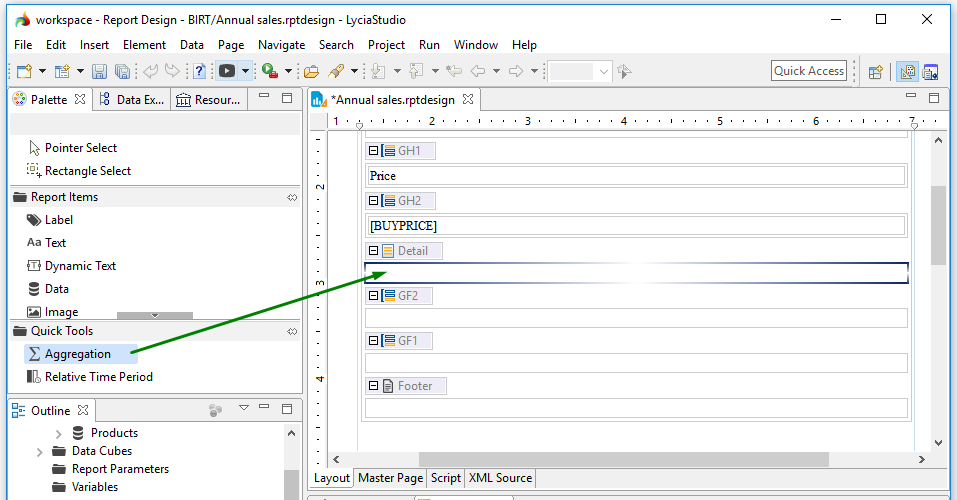
You get access to this functionality by means of the Aggregation tool (available from Palette).
Here is the list of math operations you can perform on your data (the exact operation depends on the contents of the column and type of data):
|
AVE CONCATENATE COUNT COUNTDISTINCT FIRST IRR IS-BOTTOM0N IS-BOTTOM-N-RECENT |
IS-TOP-N IS-TOP-N-PERCENT LAST MAX MEDIAN MINMIRR MODE MOVINGAVE |
NPV PERCENTILE PERCENTRANK PERCENTSUM QUARTILE RANK RUNNINGCOUNT |
RUNNINGNPV RUNNINGSUM STDDEV SUM VARIANCE WEIGHTEDAVE |
|
AVE |
returns the average (= arithmetic mean) of its arguments | ||||
| CONCATENATE | joins several text strings into one string | ||||
| COUNT | calculates the number of cells in a range that contain numbers | ||||
| COUNTDISTINCT | is analogous to COUNT | ||||
| FIRST | returns the first value in the ordered set of values | ||||
| IRR | returns the IRR (= internal rate of return) for a series of cash flows | ||||
|
LAST |
returns the last value in the ordered set of values |
||||
|
MAX |
returns the largest value in a set of values. Ignores logical values and text. |
||||
|
MEDIAN |
returns the median of the given values or groups of values |
||||
|
MIN |
returns the smallest value in a set of values. Ignores logical values and text. |
||||
|
MIRR |
returns the IRR for a series of periodic cash flows, considering both cost of investment and interest on reinvestment of cash |
||||
|
MODE |
returns the most frequently occurring or repetitive value in the range of dates |
||||
|
NPV |
returns the NPV (= net present value) of an investment based on a discount rate and a series of future payments (negative values) and income (positive values) |
||||
|
PERCENTILE |
returns the k-th percentile of values in a range |
||||
|
PERCENTRANK |
returns the rank of a value in a data set as a percentage of the data set. The returned value ranges from 0 to 1. If a set of values contains 50, 75, 80, 90, and 95, PERCENTRANK returns 0, 0.25, 0,5, 0.75, and I for each row respectively. |
||||
|
PERCENTSUM |
returns the percent for the row of the column total |
||||
|
QUARTILE |
returns the quartile of the data set |
||||
|
RANK |
returns the rank of a value in a set of values. The rank of a value ranges from 1 to the number of values in the set. |
||||
|
RUNNINGCOUNT |
returns the running count by row for a set of values |
||||
|
RUNNINGSUM |
allows calculating totals in the report record-by-record or group-by-group |
||||
|
STDDEV |
estimates the standard deviation based on the sample. Ignores logical values and text in the sample. |
||||
|
SUM |
adds together the numeric values in a range of cells |
||||
|
VARIANCE |
returns the sample variance of the set of values |
||||
|
WEIGHTEDAVE |
returns the weighted average value in a set of values, given weights specified in another set of values. In a weighted average, some numbers carry more importance than others. For example:
Given this set of scores and weights, WEIGHTEDAVE returns 81,75. |
More information is available here.
As the data in the report is organized in columns, aggregation tool is applied to the columns (and not to the rows, separate cells, or the database as a whole).
You can use aggregation in reports organized as tables and lists.
If your list contains several groups, you can apply aggregation to the whole list or to each group separately.
You can use aggregation as many time in your report as you need:
- perform one math operation for one column,
- perform several different operations for one column,
- perform one math operation for several different columns, and
- perform several different operations for several different columns.
You can perform one or several operations for several different columns one by one (e.g. SUM for the Totals column and SUM and MAX for the Discount column.
But you CANNOT use SUM to add together the contents of the Totals and Discount columns).
To perform aggregation to a certain piece of data, please follow these steps.
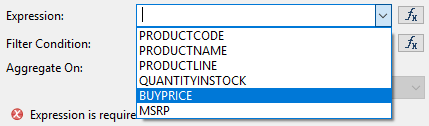
After this, the Aggregation builder window will open:

This name is displayed next to the cell with the aggregated value:

Usually, only these two fields are used when applying aggregation. Other fields are auxiliary and are used only if you want to add some specific properties.
You can read about other available fields below.

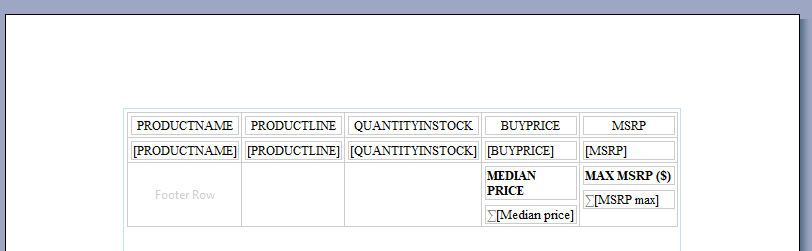
In the report editor, aggregation looks like this:

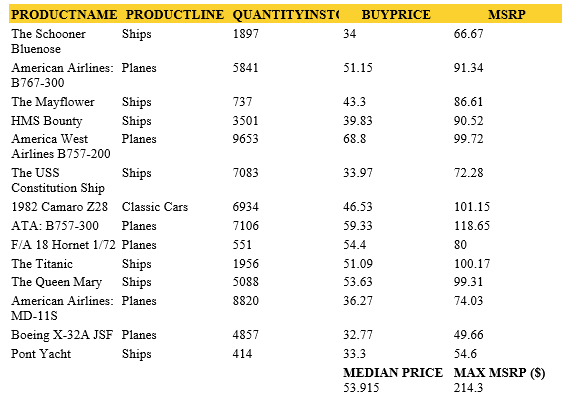
When you generate the output for you report, it will look like this:

Aggregation builder window
Aggregation builder window is used for setting parameters for the aggregation tool.
Usually, only three fields are used to build aggregation - Display Name (in Step 2 above), Expression (Step 3), and Function(Step 4).
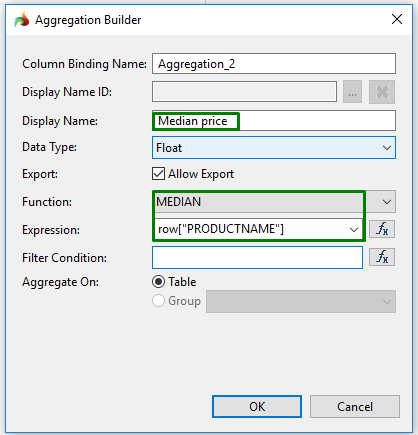
Other fields are auxiliary and are used only if you want to add some specific properties to the aggregation tool.
Column Binding Name is set automatically, and displays the number of aggregation applied to the report.
If necessary, you can change it by typing in some other name.

The Display Name ID option allows you to display the necessary ID name for the aggregation tool;

In the Data Type drop-down list, you can specify the data type of the values you want to process.

When checked, the Export option allows exporting the aggregation results:

TheFilter condition option allows filtering the values to exclude them when aggregating.
E.g., if you want to use aggregation on a column but want to exclude some rows, you go to Expression Builder and select the element you want to exclude.


The Aggregate on option allows you to aggregate data on grids or on groups by checking the corresponding option.