Step 2: Selecting the chart type

Chart types
BIRT platform supports different types of charts.
Bar charts
Bar charts show horizontal or vertical bars, with the values displayed in the bottom of the chart:

- Side-by-side bar charts show bars one beside the other. The width of the bar depends on the number of series being plotted.
- Stacked bar charts show bars stacked one above the other. Stacked bar charts show totals for each series and proportions that each series contributes to the grand total.
- Percent stacked bar chart shows multiple bars stacked vertically and displays values as a percentage of the whole.
Tube, cone, and pyramid charts are variations of bar charts that use tubular, conical, and pyramid-shaped risers instead of bars:


Line chart
Line charts display data as a set of points connected by a line:

- Overlay line charts show multiple series as overlapping lines.
- Overlay line charts show lines from each series independent of the others.
- Stacked line charts show totals for each series as well as proportions that each series contributes to the total.

Pie charts
Pie charts are circular charts that are sliced into sections where each section represents a percentage of the whole.

Meter chart
Meter charts display values as a needle pointer on a circular or semicircular dial:

- Standard meter charts display multiple values in multiple dials: Here each dial displays a single value.
- Superimposed meter chart display multiple values in a single dial: Here dials overlap so that the chart can represent multiple needles.
Stock chart
Stock charts show data as points on a time continuum (e.g., week days):

Scatter chart
Scatter charts show data as points. Their values can be displayed on both axes:

Bubble chart
Bubble charts are the scatter charts that use bubbles instead of points. Bubble charts are used when you have several values per a data point:

Difference chart
Difference charts show variation between two sets of data by shading the areas between the points of comparison:

How to specify the chart type
.png)
To specify the type of the chart, please follow these steps.

Read here about the chart types.

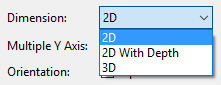
Chart dimensions depend on the type of the chart.
For some types, only 2D is available. For others, 2D with depth or 3D can be set as well.
Can be horizontal or vertical:

You can chose among PNG, JPG, BMP, and SVG:

With several graphs, it is recommended to select the 2D With Depth dimension:

This option becomes available when the secondary axis in the Multiple Y Axis field is selected.

If in this stage you press Finish, you will get a window listing the errors encountered by the program:
![]()
If you select Proceed Without Fixing, the table will be added as it is (the axis and the history won't be specified).