Launching Program in Debug Mode
There are two ways to start debugging a compiled program using LyciaStudio:
-
Right-click the program in the ‘4GL Project’ view and select the "Debug As..." option. Then choose one of the graphical clients you have installed.
-
Use the Debug menu by pressing the  Debug button
When the program hits the first breakpoint, the execution will be suspended and a pop-up window will appear asking whether you want to switch to the ‘Debug’ perspective. Press OK to switch to the ‘Debug’ perspective. It will be loaded as shown below:

The Debug perspective displays the stack frame for the suspended threads for each target that you are debugging in the ‘Debug’ view. Each thread within the program appears as a node in the tree. It displays the process for each target you are running. If the thread is suspended, the stack frames are shown as child elements.
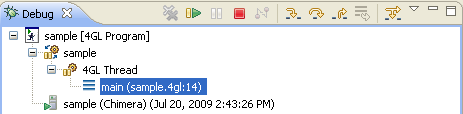
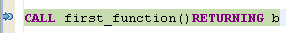
Currently, in our example, the 4GL thread is suspended and has one child element which is the result of the first breakpoint on line 14 in the main section of the 4GL Source File example. This breakpoint will also be correspondingly highlighted in the ‘Editor’ view as shown below: