Debug view
Debug view displays the target debugging information in tree hierarchy:

Debug toolbar

From the toolbar of the Debug view, these actions are available:
|
|
Remove all terminated launches |
clears all terminated processes in the Debug view |
|
|
Resume |
resumes the execution of the currently suspended debug target |
|
|
Suspend |
interrupts the currently selected thread in a debug target |
|
|
Terminate |
ends the selected debug session and/or process (the impact of this action depends on the type of the selected item) |
|
|
Disconnect |
disconnects the debugger from the selected process |
|
|
Step into |
when debugger encounters a function, sends the debugger into the function but not into the next line after the function call |
|
|
Step over |
when debugger encounters a function, sends the debugger into the next line after the function call but not into the function |
|
|
Step return |
sends the debugger out of the function and into the function body |
|
|
Drop To Frame |
reenters the selected stack frame in the Debug view |
|
|
Instruction Stepping Mode |
enables the instruction stepping mode (in this mode, the debugger can debug the program as it steps into the disassembled code) |
|
|
Use Step Filter |
enables the step filter in the debug mode |
|
View menu |
opens the drop-down menu ↓:
|
|

|
Minimize |
minimizes the view |

|
Maximize |
maximizes the view |
From the drop-down menu of the Debug view, you can perform these actions:
|
Layout |
changes how the target debugging information is shown in the view: Automatic - automatically shows the target debugging information in tree hierarchy; Tree - provides the target debugging information in tree hierarchy; Breadcrumb - shows target debugging information as a breadcrumb trail; Auto-Expanded Breadcrumb - expands the Breadcrumbs automatically. |
|
Show Debug Toolbar |
if deselected, hides the toolbar in the Debug view:
|
|
View Management... |
allows automatically opening and closing views of the perspectives selected in the View Management window:
|
|
Java |
allows manipulating Java programs (read more here) |
Debug view context menu
From the context menu of the Debug view, you can perform these actions:
|
|
Copy Stack |
copies the selected stack of suspended threads and the state of the running threads to the clipboard |
|
Find |
opens the search dialog in the Debug view |
|
|
|
Relaunch |
relaunches the selected debug target |
|
|
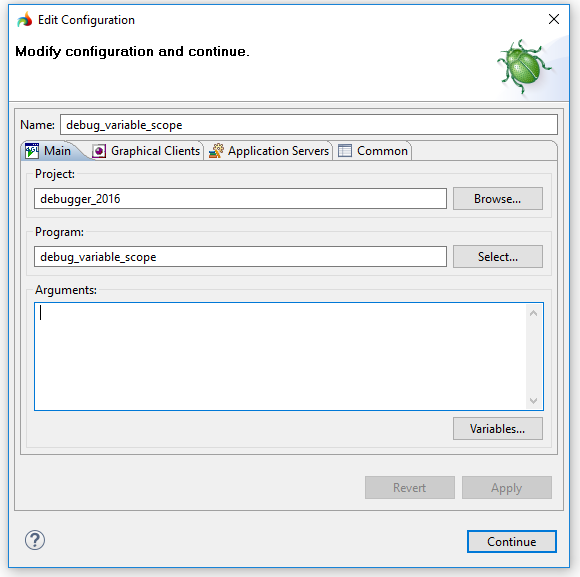
Edit debug variable scope... → |
opens the Edit configuration window that allows modifying configurations, selecting a graphical client, etc.:
|
|
|
Edit source lookup... |
allows adding, editing, and removing Source Lookup Paths:
|
|
|
Terminate and remove |
terminates the selected debug target and removes it from the view |
|
Properties |
opens the Properties window to show the process properties:
|


