Adding tables
Table objects serve for arranging data in your report.
You can populate your tables with labels, text, images, charts, and other objects from Palette.
There are two ways to create a table.
You can:
- create an empty table - in this case, you must populate it with data manually;
- create a table from a data set in this case, it is populated automatically.
Creating an empty table
To add an empty table, please follow these steps.
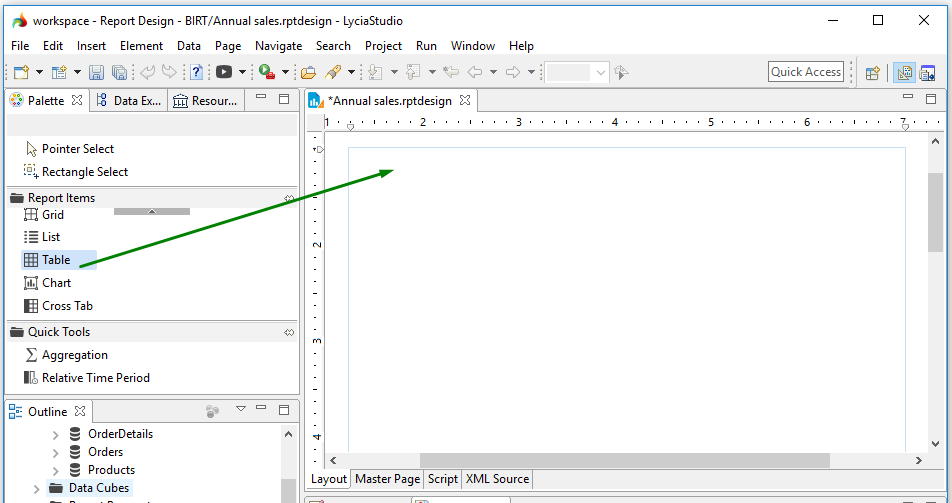
After this, the Insert Table window opens:

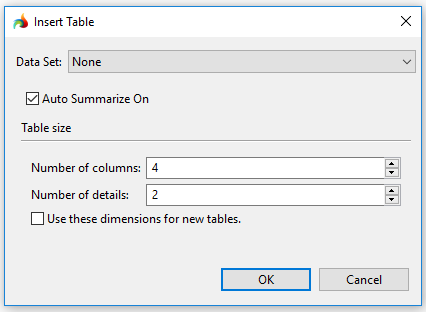
You can tell the BIRT report engine to always create table of the same size by checking Use these dimensions for new tables:

Now you can manually populate your table with visual elements and/or files from a data set.
Creating a table from a data set
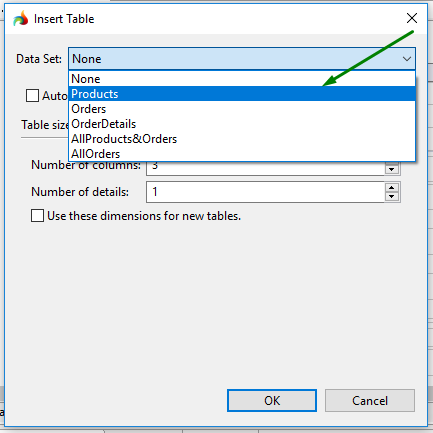
To create a table from an existing data set please follow these steps.
Step 1. Open the Insert Table window as described above.

As you can see, it contains the data from the data set.
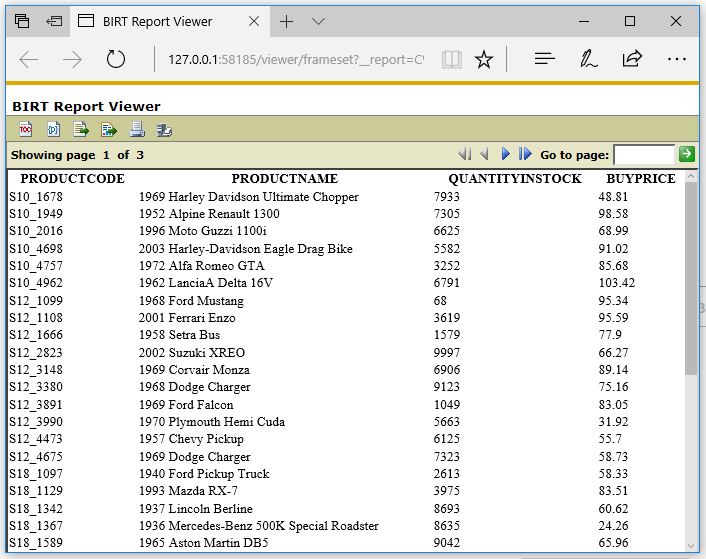
To see what this table looks like in the actual report, you can generate the output:
This video offers a short overview of how to create tables.
Formatting tables
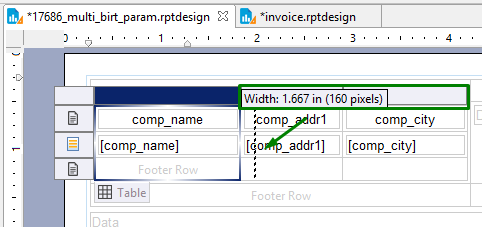
Table columns are easily resized by simple dragging (like it any text editor):
You can change your table style in the Property editor


