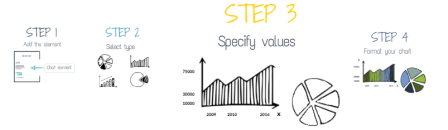
Step 3: Specifying series for the chart
To make your chart reflect data relationships, you must bind the chart series to a data set:

To bind the series to a data set, please follow these steps.
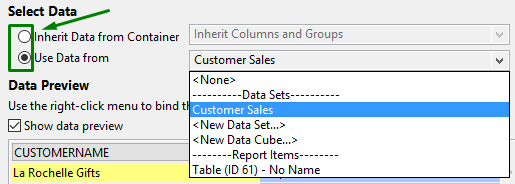
There are two options you can choose:
Inherit Data from Container allows inheriting columns and groups created in the report before.
Use Data From allows selecting values from the existing data sources, data sets, or data cubes.
They are considered and called rows by the report editor):
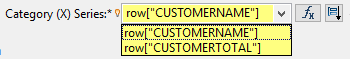
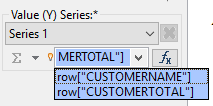
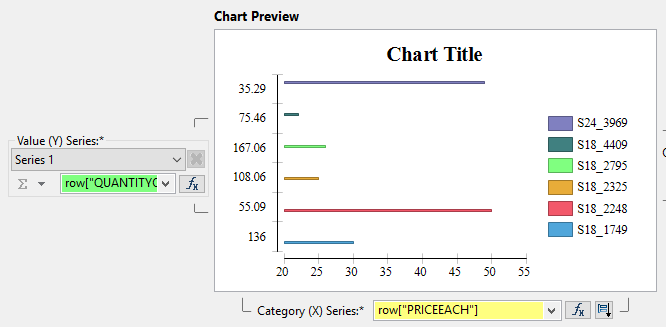
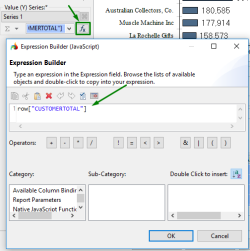
You can choose them from the drop-down list or specify the values manually by means of Expression builder:
After you select the data source (Step 1), Data Preview shows the retrieved data as a table:

After you specify the necessary series (Step 2), Data Previewhighlights the selected columns:

From the context menu of the Data Preview, you can choose what series is displayed on the x and y axes.
Here is a description of the buttons in the Select Data tab:

|
opens the Filters window where you can add and edit filter conditions:
|
|
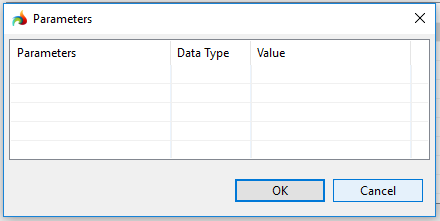
opens the Parameters window where you can view the parameters of your series:
|
|
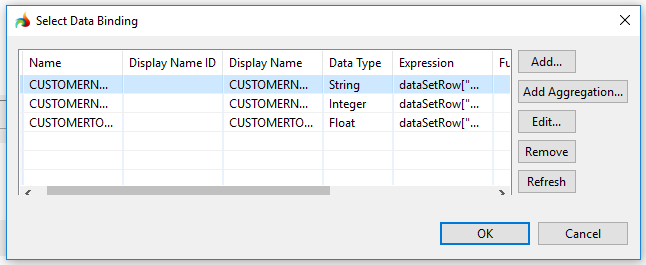
opens the Select Data Binding window where you can add, edit, and remove data bindings and adding aggregation:
|