Charts
Compound business reports often include charts to make data more explicit and evident.
BIRT platform supports different types of charts and provides advanced functionality for including these charts in your reports.
As any BIRT objects, charts are built from data sources and data sets.
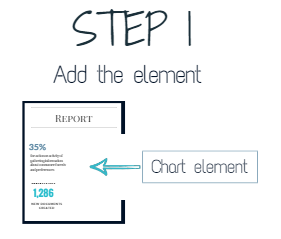
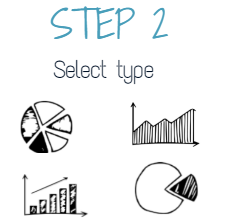
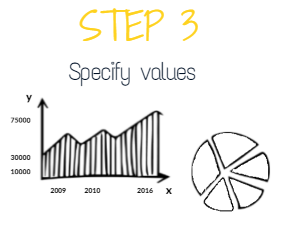
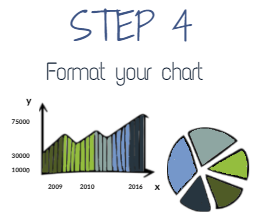
Charts are added in 4 simple steps - you can see this process in graphic form below (images are clickable and lead to the corresponding pages).
|
|
|
|
This video offers a short overview of how to create charts through the example of creating cone charts: